The settings menu
You can open the settings menu by tapping or clicking the menu drawer icon:

Swiping the screen from left to right will also work on touchscreen devices.
Display switches#

These switches will allow you to enable or disable different parts of the spectrogram canvas.
View duration#

This slider lets you choose how much time the spectrogram canvas spans on the time axis. It also indirectly controls the scrolling speed of the canvas.
Be careful with high values as they can cause the program to slow down significantly.
View frequency range#

This slider lets you control the range of frequencies that will be displayed on the spectrogram canvas. It does not update linearly and follows the Mel frequency scale.
View frequency scale#

This lets you choose the scale of frequencies with which the spectrogram canvas will render the spectrogram as well as the pitch and resonance tracks.
Linear and logarithmic scales are common options but both Mel and ERB are designed to more accurately model human hearing. This is why ERB is the default setting for this field.
FFT size#

This is the classic NFFT parameter whichi controls the time-frequency resolution of the spectrogram.
This only takes powers of two (16, 32, 64, etc., up to 16384).
Be careful with values higher than 4096 as they can cause the program to slow down significantly.
Gain normalization#

This controls how bright or how dim the spectrogram displays a given loudness. Lower values brighten the spectrogram, higher values dim it.
Algorithms#
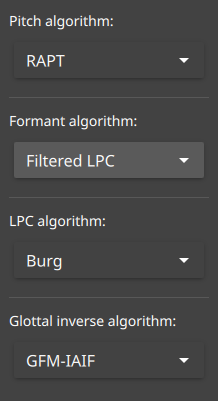
This lets you control which implementation of the various tracking algorithms is being used.
The default algorithms should provide satisfactory tracking out of the box, changing this is highly experimental!